.JPG)
Articles on the book "Modernist Cuisine" first introduced me to the sous-vide cooking technique. In a nutshell, it's a high-end crock pot that cooks your food to perfection, every time, with almost no effort. The downsides being that the machine costs $500 and it takes hours to cook even the fastest items. But I'm not going to go into the reasons why to cook sous-vide, just click the link or Google it for more details.
Instead, I'm here to describe how I built my own sous-vide machine, and how I completely over-designed it to do all the things that don't really need to be done, but are very cool and serve as a template for turning any dumb appliance into a smart, internet connected device.
Project Summary:
- $29 Crock pot from Walmart
- solid-state-relay to control power to the crock pot
- Arduino using the PID library to control the solid state relay
- waterproof DS18B20 to measure the water temperature
- Ethernet shield to provide internet connectivity
- MQTT client protocal running on the arduino for M2M communication
- raspberry pi running a MQTT broker, node.js, Apache and PHP
- node.js script that subscribes to the MQTT broker, and logs all temperature data to a file
- Google charts API to render real-time plots of the sous-vide in operation
- aquarium air pump to blow bubbles into the water to help circulate the water.
The Arduino hardware:

Here's a PCB that I drew up. Probably not much point in having it fab'd unless other people want copies.

The Arduino code:
.JPG)
This code measures the temperature of the water using the DS18B20 temperature setting, and feeds that into the Proportional-Integral-Derivative (PID) controller, to calculate the optimal duty cycle for the pulse-width-modulated (PWM) signal being sent to the relay. The PWM cycle is 5 seconds, so a 20% duty cycle would turn the relay on for 1 second and off for 4 seconds, every PWM cycle.
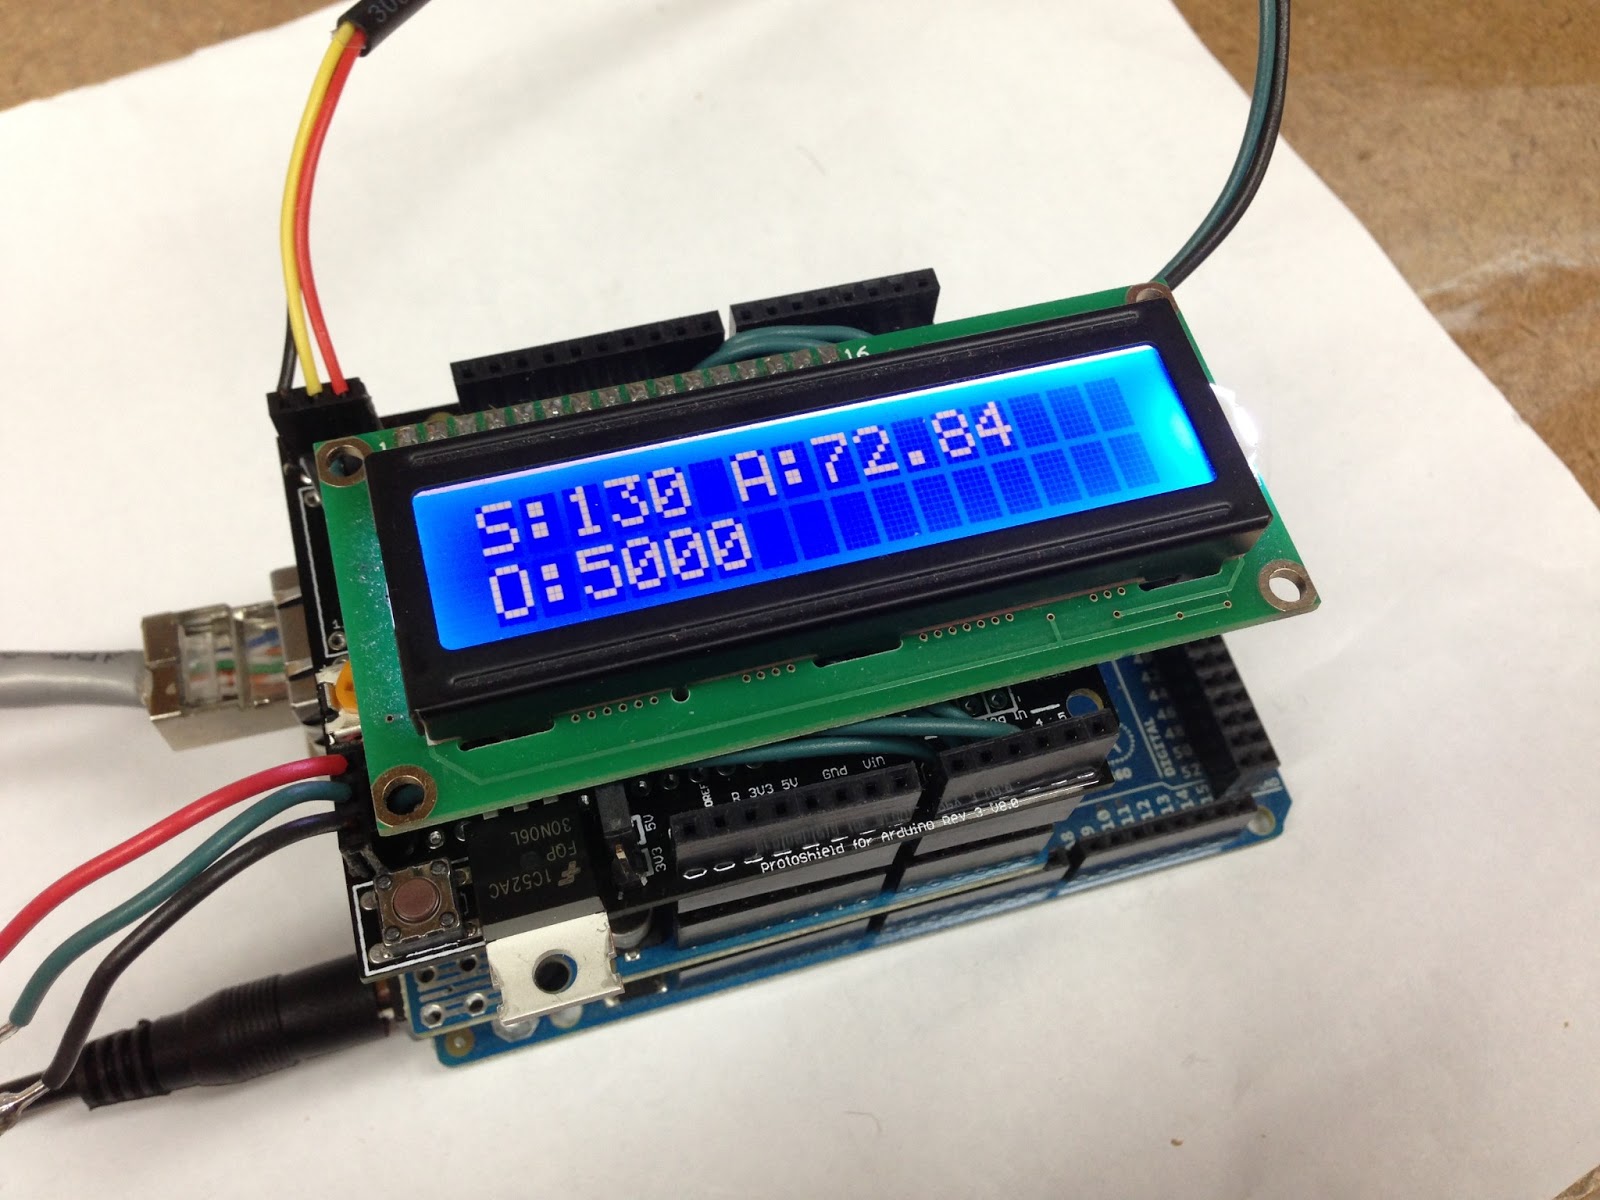
- The LiquidCrystal.h library is to control the LCD, which allows me to see the temperature setpoint (S) the actual temperature (A) and the PWM output (O) measured in milliseconds. In the picture, 5000 milliseconds means that the relay is on 100% of the 5 second cycle, or full-on. I set the temperature using a 10k potentiometer wired into one of the analog pins.
- The Ethernet.h library is used to communicate with the Ethernet shield, and is very convenient that v1.0 now supports DHCP, so obtaining an IP address is now just plug and play.
- The OneWire.h and DallasTemperature.h libraries are to interface with the DS18B20 one-wire temperature sensor.
- The PubSubClient.h library is used to implement the Multiple-Queue-Telemetry-Transport (MQTT) protocol, which is a lightweight protocol for machine-to-machine (M2M) communication. MQTT is a publish/subscribe protocol, which is divided into "topics". Any client can subscribe or publish to any topic. Whenever a client publishes to a topic, all clients that are subscribed to that topic receive that message.
I use the following MQTT topics:
- cmd - for sending commands to the arduino
- stdout - for status replies from the arduino
- data - for real-time temperature log data
#include <PID_v1.h>
#include <SPI.h>
#include <Ethernet.h>
#include <PubSubClient.h>
#include <OneWire.h>
#include <DallasTemperature.h>
#include <LiquidCrystal.h>

double logTime = 0;
int logInterval = 30000; // millis interval between mqtt reports
int pwmWindowSize = 5000; // PWM window for relay
int lcdInterval = 1000; // interval for LCD updates
unsigned long pwmWindowStartTime;
double output; // PID output for relay control
//double kp=675, ki=0.1, kd=0; // PI tuning
//double kp=943, ki=1.13, kd=1909; // PID tuning
double kp=600, ki=0.06, kd=2.4; // PID tuning
double setpoint; // desired temp
double temperature; // actual temp
unsigned long logTimer; // timer for log updates
unsigned long lcdTimer; // timer for LCD updates
String string; // temporary var for data type conversion
char buffer[256]; // temporary var for data type conversion

// Relay on pin 17
#define relayPin 7

// 10kohm pot
const int analogInPin = A0;
int potValue = 0;

// LCD pins (RS,E,D4,D5,D6,D7)
LiquidCrystal lcd(A1,A2,6,5,3,2);

// Setup a oneWire instance to communicate with any OneWire devices
#define ONE_WIRE_BUS 9
OneWire oneWire(ONE_WIRE_BUS);
// Pass our oneWire reference to Dallas Temperature.
DallasTemperature sensors(&oneWire);

// Setup PID
PID myPID(&temperature, &output, &setpoint, kp, ki, kd, DIRECT);

// Update these with values suitable for your network.
byte mac[]    = { 0x90, 0xA2, 0xDA, 0x0D, 0x7D, 0x3A };
byte server[] = { 192, 168, 1, 101 };

// start ethernet client
EthernetClient ethClient;
// start mqtt client
PubSubClient mqttClient(server, 1883, callback, ethClient);

#define lcdBacklight A3
boolean networked = true;

void setup()
{
  Serial.begin(9600); // disable Serial, to regain use of pins 0,1
  pinMode(lcdBacklight,OUTPUT);
  digitalWrite(lcdBacklight,HIGH);
  lcd.begin(16,2);
  lcd.clear();
  lcd.print("Requesting IP");
  lcd.setCursor(0,1);
  lcd.print("from DHCP");
  if (networked) Ethernet.begin(mac);
  if (networked) mqttConnect();
  logTimer = millis();
  pwmWindowStartTime = millis();
  sensors.begin();
  myPID.SetOutputLimits(0, pwmWindowSize);
  myPID.SetMode(AUTOMATIC);
  pinMode(relayPin,OUTPUT); // disable Serial if using pin 0,1
  mqttClient.publish("stdout","restart"); // restart the log file
}

void loop()
{
  // read temperature sensor
  sensors.requestTemperatures(); // read DS18B20
  temperature = sensors.getTempFByIndex(0);
  Serial.print("temp: ");
  Serial.print(temperature);

  // read pot
  potValue = analogRead(analogInPin);
  setpoint = map(potValue, 0 , 1023, 130, 185); // 130F min safe food temp
  Serial.print(" set: ");
  Serial.println(setpoint);

  if (networked) logUpdate(); // publish temperature data to mqtt channel "data"
  lcdUpdate(); // update lcd
  relayUpdate(); // implement pwm on relay
  myPID.Compute(); // PID compute loop

  if (networked && mqttClient.loop() == false) mqttConnect();  // reconnect if I've lost connection to mqtt
}

void callback(char* topic, byte* payload, unsigned int length) {
  // handle message arrived
  String content="";
  char character;
  for (int num=0;num<length;num++) {
    character = payload[num];
    content.concat(character);
  }
  if (content=="getKp") dtostrf(myPID.GetKp(),2,2,buffer);
  else if (content=="getKi") dtostrf(myPID.GetKi(),2,2,buffer);
  else if (content=="getKd") dtostrf(myPID.GetKd(),2,2,buffer);
  else if (content=="stop") { myPID.SetMode(MANUAL); strncpy(buffer,"PID off",sizeof(buffer)); }
  else if (content=="start") { myPID.SetMode(AUTOMATIC); strncpy(buffer,"PID on",sizeof(buffer)); }
  else if (content.startsWith("setKp=")) {
    content.replace("setKp=","");
    content.toCharArray(buffer,content.length()+1);
    myPID.SetTunings(strtod(buffer,0),myPID.GetKi(),myPID.GetKd());
  }
  else if (content.startsWith("setKi=")) {
    content.replace("setKi=","");
    content.toCharArray(buffer,content.length()+1);
    myPID.SetTunings(myPID.GetKp(),strtod(buffer,0),myPID.GetKd());
  }
  else if (content.startsWith("setKd=")) {
    content.replace("setKd=","");
    content.toCharArray(buffer,content.length()+1);
    myPID.SetTunings(myPID.GetKp(),myPID.GetKi(),strtod(buffer,0));
  }
  mqttClient.publish("stdout",buffer);
}

// this is what to do whenever I'm disconnected from MQTT
void mqttConnect() {
  Serial.println("mqttConnect");
  if (mqttClient.connect("arduinoClient")) {
    mqttClient.subscribe("cmd");
    Serial.println("[INFO] connected to mqtt");
  }
}

void logUpdate() {
  if(millis()>logTimer) {
    logTime+=0.5;
    logTimer+=logInterval;
    dtostrf(logTime,2,1,buffer);
    size_t len=strlen(buffer);
    buffer[len++] = ',';
    dtostrf(temperature,2,1,&buffer[len]);
    len = strlen(buffer);
    buffer[len++] = ',';
    dtostrf(setpoint,2,0,&buffer[len]);
    len = strlen(buffer);
    buffer[len++] = ',';
    dtostrf(output/pwmWindowSize*100,2,0,&buffer[len]);
    mqttClient.publish("data",buffer);
  }
}

void lcdUpdate() {
  if(millis()>lcdTimer) {
    lcdTimer+=lcdInterval;
    lcd.clear();
    lcd.print("S:");
    dtostrf(setpoint,3,0,buffer);
    lcd.print(buffer);
    lcd.print(" A:");
    lcd.print(temperature);
    lcd.setCursor(0,1);
    lcd.print("O:");
    dtostrf(output,1,0,buffer);
    lcd.print(buffer);
  }
}

void relayUpdate() {
  if(millis() - pwmWindowStartTime>pwmWindowSize)
  { //time to shift the Relay Window
    pwmWindowStartTime += pwmWindowSize;
  }
  if(myPID.GetMode()==MANUAL) output = 0;
  if(output > millis() - pwmWindowStartTime) {
    digitalWrite(relayPin,HIGH);
  } else {
    digitalWrite(relayPin,LOW);
  }
}
The Node.js script on the Raspberry Pi:
The node.js script is a very simple script that subscribes to the "data" and "stdout" topics on the MQTT broker (also running on the raspberry pi). All packets on the "data" topic get logged to a file. If the message "restart" is seen on the "stdout" topic, then the existing log is deleted to restart data logging.
var sys = require('sys');
var mqtt = require('mqttjs');
var fs = require('fs');

process.on('uncaughtException', function (error) {
    console.log(error.stack);
});

mqtt.createClient(1883, '192.168.1.101', function(err,client) {
    if (err) {
        console.dir(err);
        process.exit(-1);
    }

    client.connect({keepalive: 3000});

    client.on('connack', function(packet) {
        client.subscribe({topic: 'data', qos: 0})
        client.subscribe({topic: 'stdout', qos: 0})
    });

    client.on('publish', function(packet) {
        sys.puts(packet.topic+" : "+packet.payload);
        if (packet.topic == 'data') {
            fs.appendFile('/logs/log.csv', packet.payload+"\n", function(err) {
                if (err) throw err;
            });
        };
        if (packet.topic == 'stdout' && packet.payload == 'restart') {
            sys.puts('deleting /logs/log.csv');
            fs.unlink('/logs/log.csv', function(err) {
                if (err) throw err;
            });
        };
    });
});
The Google Charts web page on the Raspberry Pi:

This html utilizes the Google charts API to render in your browser, a plot of the data being sent by the arduino and logged by the node.js script.
<!DOCTYPE HTML>
<html>
  <head>
    <meta charset="UTF-8">
    <meta http-equiv="refresh" content="30">
    <!--Load the AJAX API-->
    <script src="https://www.google.com/jsapi"></script>
    <script src="https://ajax.googleapis.com/ajax/libs/jquery/1.8.2/jquery.min.js"></script>
    <script>

        // Load the Visualization API and the piechart package.
        google.load('visualization', '1.0', {'packages':['controls']});

        // Set a callback to run when the Google Visualization API is loaded.
        google.setOnLoadCallback(drawChart);

        /* getData calls an external url to populate and return a json object
        suitable for google charts as a dataTable.  Validate the incoming json
        text with a site like http://jsonlint.com/.

        The first column should be the Time.
        The second column should be the total number of bugs
        Subsequent columns can be whatever you want (optional)

        The format should look like:
                {
                "cols": [
                        {"label":"Time","type":"number"},
                        {"label":"Temperature","type":"number"},
                        {"label":"Setpoint","type":"number"},
                        {"label":"Power","type":"number"}
                        ],
                "rows": [
                        {"c":[{"v":"7"},{"v":60},{"v":134},{"v":100}]},
                        {"c":[{"v":"8"},{"v":60},{"v":134},{"v":100}]},
                        {"c":[{"v":"9"},{"v":65},{"v":134},{"v":100}]}
                        ]
                }
        */
        function getData(myUrl) {
                var jsonString = $.ajax({url: myUrl,dataType:'json',async: false}).responseText;
                // convert string to json
                var obj = jQuery.parseJSON(jsonString);
                return obj;
        }

        function drawChart() {
                // get dataTable
            var jsonData = getData("csv2json.php");
                var data = new google.visualization.DataTable(jsonData);

                // Create a dashboard.
                var dashboard = new google.visualization.Dashboard(
                        document.getElementById('dashboard_div'));

                var today = new Date();

                var control = new google.visualization.ControlWrapper({
                        'controlType': 'ChartRangeFilter',
                        'containerId': 'control_div',
                        'options': {
                                // Filter by the date axis.
                                'filterColumnIndex': 0,
                                'ui': {
                                        'chartType': 'LineChart',
                                        'chartOptions': {
                                                'chartArea': {'width': '80%'},
                                                'hAxis': {'baselineColor': 'none'}
                                        },
                                        // Display a single series that shows the total bug count
                                        // Thus, this view has two columns: the date (axis) and the count (line series).
                                        'chartView': {'columns': [0, 1]},
                                        // 1 day in milliseconds = 24 * 60 * 60 * 1000 = 86,400,000
                                                     // 1 minute in milliseconds = 1000 * 60
                                        'minRangeSize': 60000
                                }
                        }
                        // Initial range: half hour ago
                        //'state': {'range': {'start': new Date(today.getTime()-1000*60*60*24), 'end': today}}
                });

                var chart = new google.visualization.ChartWrapper({
                        'chartType': 'ComboChart',
                        'containerId': 'chart_div',
                        'options': {
                                // Use the same chart area width as the control for axis alignment.
                                'chartArea': {'height': '80%', 'width': '80%'},
                                //'hAxis': {'slantedText': false,'maxAlternation':1},
                                //'vAxis': {'viewWindow': {'min': 0}},
                                'legend': {'position': 'in'},
                                'title':'Chuck\'s Sous-Vide Temperature Log',
                                'hAxis':{'title': 'Minutes'},
                                'vAxis':{'title': 'Fahrenheit/PWM duty cycle'}
                        },
                });

                dashboard.bind(control, chart);
                dashboard.draw(data);
        }
    </script>
  </head>
  <body>
        <div id="dashboard_div">
                <div id="chart_div" style="width: 800px; height: 500px;"></div>
                <div id="control_div" style="width: 800px; height: 50px;"></div>
        </div>
  </body>
</html>
The csv2json php script:
The log file is in a csv format, and the html uses ajax/jQuery to call the csv2json.php script to convert the csv logfile into a json javascript object notation.
{
"cols": [
        {"label":"Time","type":"number"},
        {"label":"Temperature","type":"number"},
        {"label":"Setpoint","type":"number"},
        {"label":"Power","type":"number"}
        ],
"rows": [
<?php
$rows = array();
$handle = @fopen("/logs/log.csv","r");
if ($handle) {
   while (($buffer = fgets($handle)) !== false) {
      $buffer = chop($buffer);
      $csv = preg_split("/,/",$buffer);
      $line = '    {"c":[{"v":' . $csv[0] . '},{"v":' . $csv[1] . '},{"v":' . $csv[2] . '},{"v":' . $csv[3] . '}]}';
      array_push($rows,$line);
   }
   echo implode (",\n",$rows) . "\n ]\n}";
}
?>
Hi Chuck,
ReplyDeleteIt looks amazing. I've been working on something similar with a few different details. I've been using an Arduino Yún which has onboard WiFi and the ability to run Linux commands. Instead of a local webserver I'm up/downloading data to my webserver on the internet. For controlling the system I've written an app, that can access the same data - allowing me to alter temperature and pump state (on/off). This way I can monitor/set the temperature from my smartphone.
Seems like I'm not the only one who loves a good steak :D
Keep up the good work :)
Greetings from Denmark!
Hello,
ReplyDeleteThe Article on Internet-of-Things-Sous-Vide Cooker Project is nice give detail information about it. Thanks for sharing the information about it. iot application development
Dear Embeddedtek Team,
ReplyDeleteGreetings for the day,
We feel glad to inform you that your website/blog titled (Internet-of-Things-Sous-Vide Cooker Project and hyperlink”http://embeddedtek.blogspot.in/2013/02/internet-of-things-sous-vide-cooker.html“) was covered by our teams on our website www.engineersgarage.com
The coverage can be locate at (Internet-of-Things-Sous-Vide Cooker Project and hyperlink"https://www.engineersgarage.com/mygarage/internet-things-sous-vide-cooker-project"). You may use the same link to share the story among your community/followers.
If you would like to submit more recently developed projects for review, you may contact us using the link (DIY Reviews, https://www.engineersgarage.com/submit/diy-reviews).
About EG:
EngineersGarage is a community of Electrical & Electronics Engineers which interacts with each other to learn and share technical knowledge. We publish high quality technical content which includes experiments, circuit design, tutorials and articles for the electronics fraternity. Our community comprises of active and loyal audience of design, research and product engineers from industries and hobbyists.
Key Statistics
1. EG currently serves 550k+ visitors every month.
2. Registered database of 300k+ engineers.
3. 1Million+ followers on Facebook.
Best Wishes
Team EG
This comment has been removed by the author.
ReplyDeleteThis comment has been removed by the author.
ReplyDeleteThis comment has been removed by the author.
ReplyDeleteHi Chuck. I am currently trying out your build but, I couldn't figure out what A3 pen should go. Also I only managed to get the LCD screen to light up blue but with no messages as I couldn't figure out which pins the LCD should go other than A1, A2, 6, 5, 3, and 2 pins. Can you show me the pins for LCD on Arduino?
ReplyDelete